- Theotokos is a living symbol of the soul.
Sunday, July 24, 2011
Wednesday, July 20, 2011
Monday, July 18, 2011
Saturday, July 9, 2011
Friday, July 8, 2011
Wednesday, July 6, 2011
Tuesday, July 5, 2011
Monday, July 4, 2011
Sunday, July 3, 2011
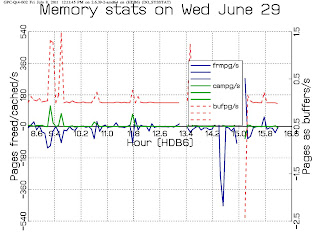
- This is the new graph created from sysstat data.
- Run Linux and install sysstat.
- The graph has 2 y-axes. The numbers of the axis are a bit confusing because Gpc-qt uses the scales routine to automatically calculate the maxima, but there is a catch ;-) You have to provide the number of divisions, which of course is difficult to do without knowing the maxima.
- I could put it on Facebook (TM) but what the heck then 200.000.000 people would see it.
- A thing to notice is that it shows the breaks when the system was down: at about 10AM and of course that IPL took place at 9:30AM and halt at 3PM.
Subscribe to:
Posts (Atom)


